We can use Debug.log to output values from Elm to the browser console. The logged values get converted to a plain text representation:
cardMsg: ((0,0),ColorPickerMsg (OnMouseDown SatLight { mousePressed = True, x = 109, y = 70 }))
model: { color = RgbaSpace 0.2789999999999999 0.7876666666666666 0.7876666666666667 1, colorPicker = State { hue = 0.5, mouseTarget = SatLight } }
This works fine for simple values, but when logging more complex data, like the whole model, for example, it becomes hard to read.
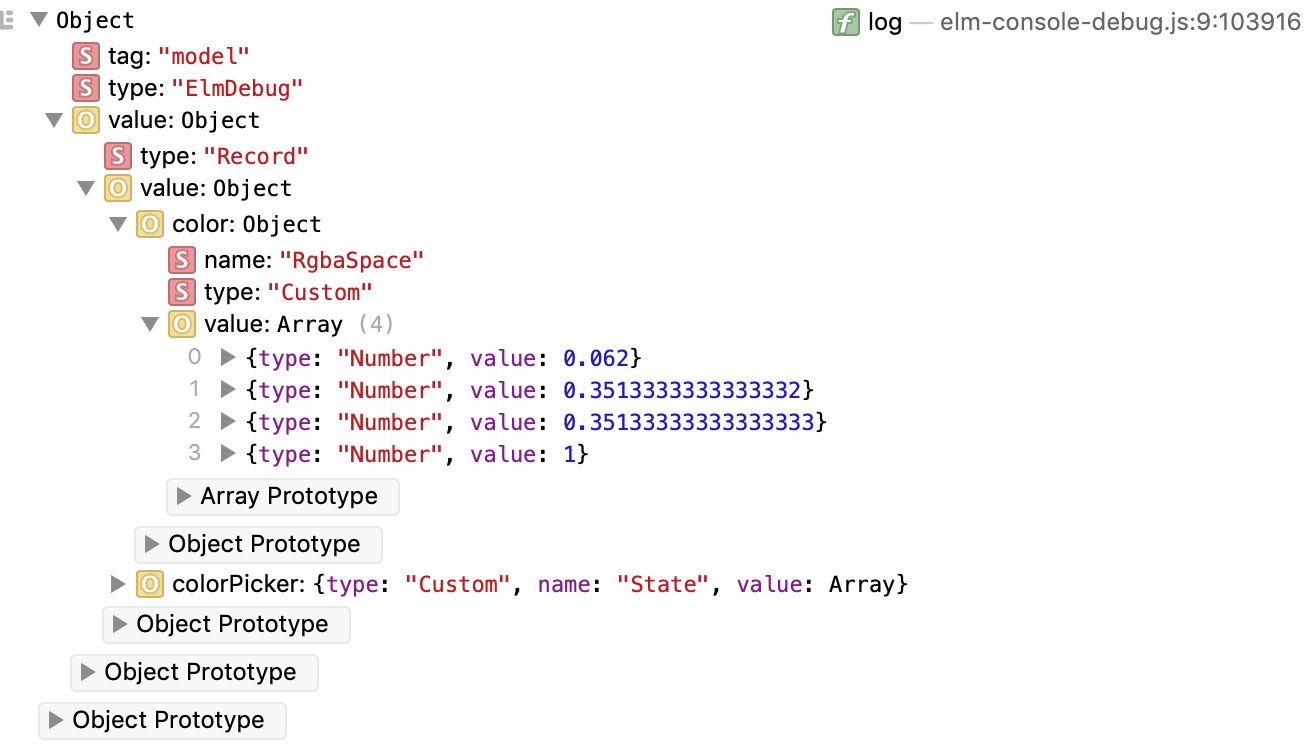
Luckily, Tomas Latal came up with a new tool which can help. It overrides console.log and tries to parse whatever is going through it. If it parses as an Elm value, it’s shown in the console as an interactive tree with expandable nodes:
Anything that fails to parse is passed to the original console.log function.
In Chrome, it’s possible to get more convenient output with the help of custom formatters, which can be enabled in the Dev Console preferences. With custom formatters, the output looks like this:
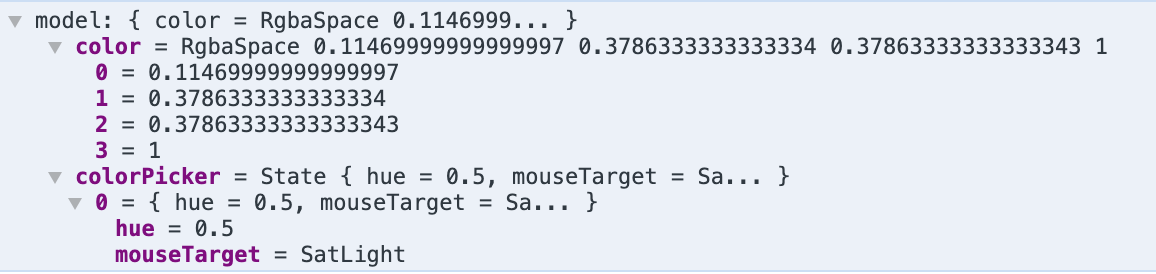
That’s very readable!
You can find the project on GitHub. The README provides instructions for installation with yarn, but it’s also possible to use npm:
npm install elm-debug-transformer
Then, you can include the script in your index.html and register the console.log wrapper:
<script src="node_modules/elm-debug-transformer/dist/elm-console-debug.js"></script>
<script>
ElmConsoleDebug.register()
</script>
In non-Chromium browsers, it’s possible to get simpler output with tuples, Set, Array and List showing as arrays and Dict showing as an object:
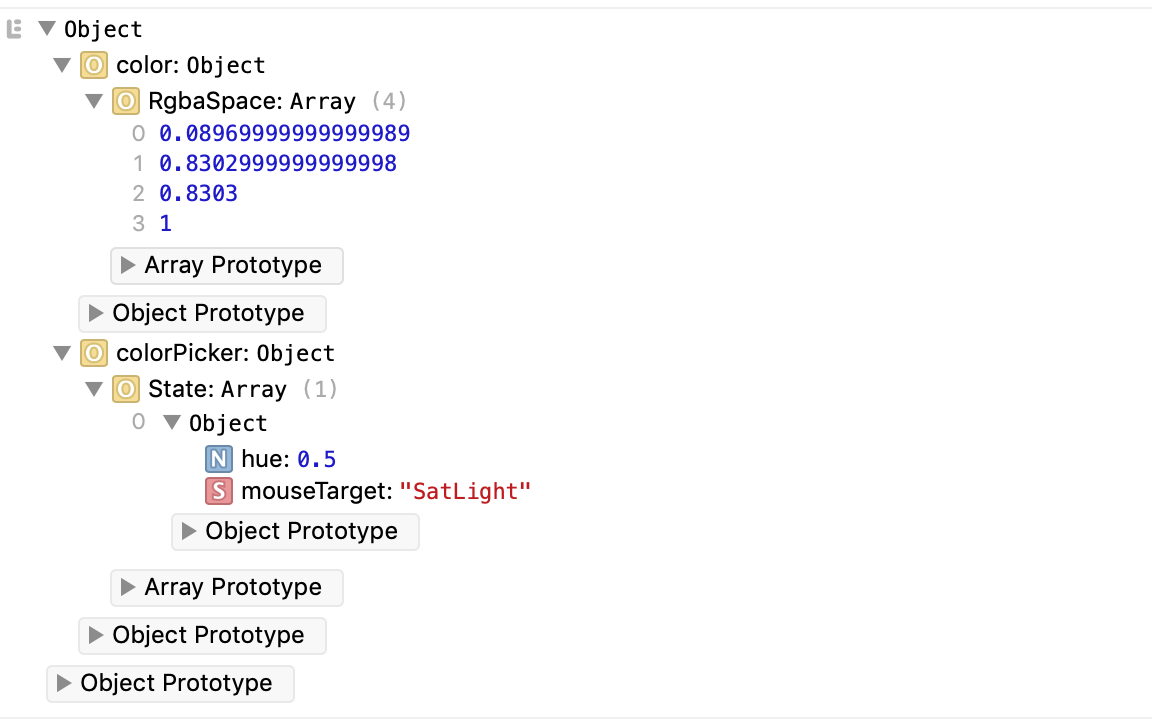
This is achieved by calling ElmConsoleDebug.register({simple_mode: true}).
I think this tool is going to become an indispensable part of my development process! I’ve also included it in the tools section of Practical Elm.